
Download Power BI Desktop , it comes with both 32 bits and 64 bits. Gets this installed.
After the Power BI installation is completed it launches with the Welcome screen.

For establishing a connection with any data source, you will need to click on the Get data icon which is visible on the welcome screen. Else you can click on the Get Data button which is visible on the untitled page as shown in the below image:

Click on More –> Online Services –> Dynamics 365 (online)

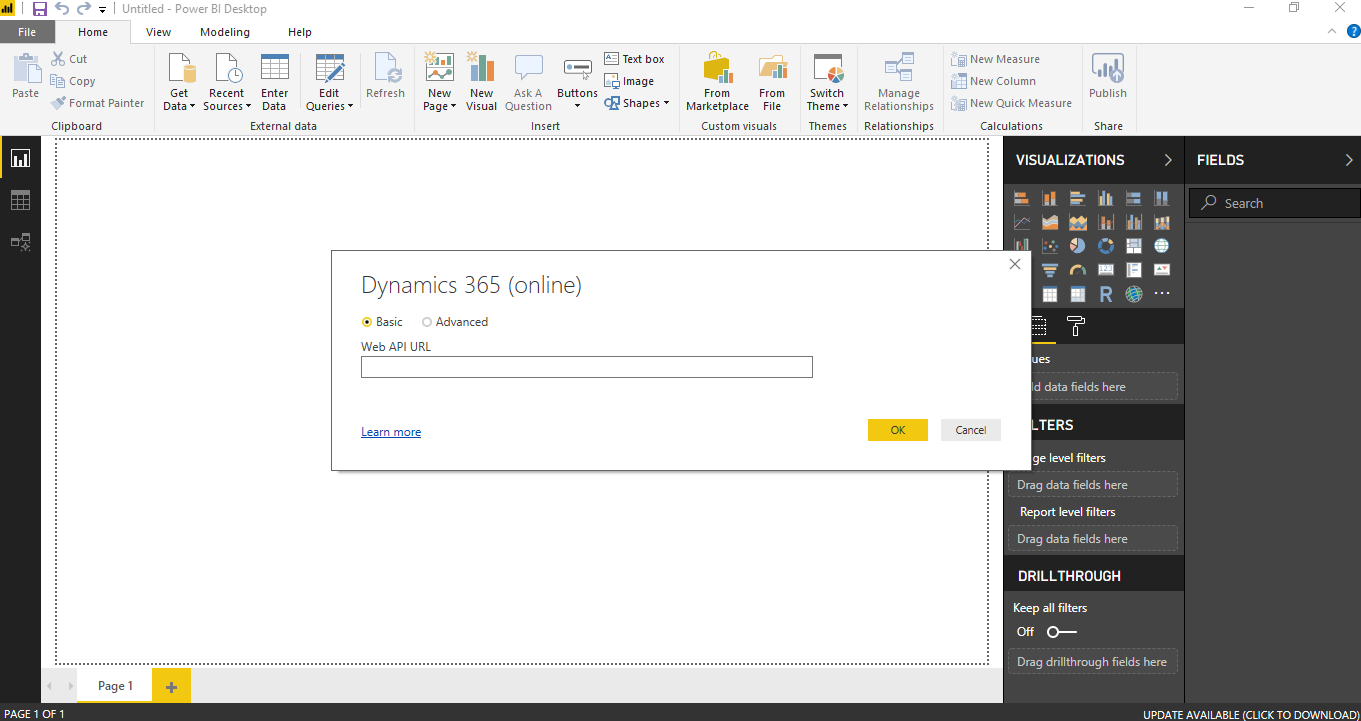
Clicking on Connect button, a screen will appear asking for CRM Web API URL.
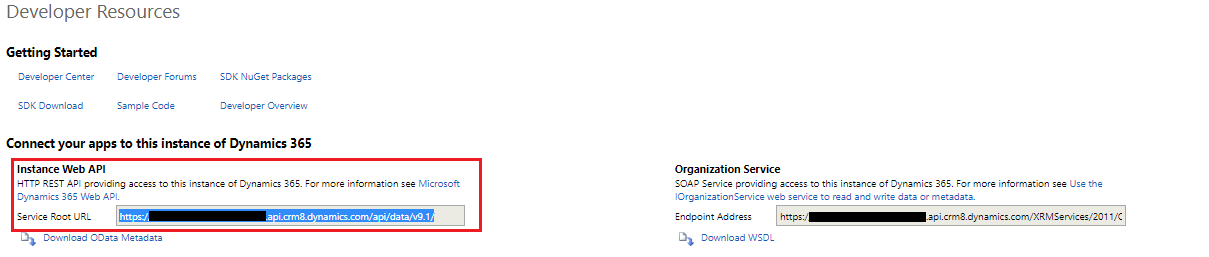
Login to CRM –> Go to Settings –> Customization –> Developer Resources

Copy the link from Service Root URL which appears under Instance Web API section.
Enter the copied CRM Web API link in Power BI, under Web API URL field. Click OK button. This required for establishing a connection between Power BI and your CRM Organization.

The below screen will appear when the connection gets established between Power BI suite and Dynamics CRM.
Select the CRM entities by clicking on the check box which appear next to them. This is required for pulling data only for the selected entities, then click Load button.

This would take some time depending on the number of entities selected for loading.
Note: If you don’t want the entire fields from the entity to get loaded. You can narrow down the fields by click on Edit button.
If user clicks on Edit button, Query Editor Page will open. Click on “Choose Columns” button under Home tab.

Select the require columns/fields which are required for reporting. You can search the field directly by entering the name of the field under Search Columns.

Clicking on OK button, the Query Editor will have only the selected field.
For reflecting the changes Click on “Close & Apply” button then select “Close & Apply” option.

Finally, the data gets Loaded. I didn’t filter the column while loading the entity as shown in Figure 8 therefore all the columns got populated as shown under red box.

You can now start with your Power BI Report by selecting any option under Visualization.
Visualization brings our data into life in the form of amazing visual representations.
