Gamification is a part of Microsoft Dynamics 365 launch. It helps the organizations to calculate their employee performance matrix into a game.
Gamification uses the principle from fantasy sports. Which create a game like experience inside the Microsoft Dynamics CRM. Bringing gamification into dynamics is designed to bring greater competition and get the user experience more fun.
Why Gamification?
Gamification has multiple sports inside its solution. Which calculate points based on the action which a user performs within CRM.
While implementing gamification if we apply more gaming principle and make the whole process more fun it may motivate users to come inside CRM and be consistent in entering data.
Note*: In short Gamification is more helpful in boosting your team productivity and Dynamics 365 user adoption.
It is a solution in dynamics 365 which allows user to participate individually or team-based game.
Security Roles in Gamification
Commissioner: Can act as an admin for all the games which are within the CRM. But can not participate in any games nor score any point.
Note*: Game commissioner has a right to create new game and mange users within Gamification portal.
Game Manager: Can help commissioner in performing some administer task. But can participate in games and score points and win awards.
User: Can score point by performing action and achieving result as per defined KPI and win awards.
Scrolling down the page you will find few sets of services. If the service for which you are looking for is not present in the list, click on See all option. This will navigate you to the page where you can find all the services which are currently present with Microsoft.
Click on the service and select the template.
Figure 2: Choose Service
If the required template is not present. You can create your template from My flows.
Today I am going to create a flow which will send an email notification whenever an account is created in Microsoft Dynamics 365 application.
Figure 3: My Flows tabFigure 4: Create a new blank flow
Clicking on Create form blank option will redirect you to the page where you can find multiple triggers. Choose a trigger to get started with the flow.
Figure 5: Choose the trigger
Select the CRM Organization under Organization Name field. This will populate all the entities respective to the selected organization under Entity name field.
Choose the CRM entity under Entity name. The flow would only trigger whenever a record is created under the selected CRM entity.
Figure 6: Choose the Organization and Entity
Click on add New step button.
Figure 7: Click New Step for adding another Trigger.
I am going to receive email notification on my outlook account therefore I am searching for Outlook, select the mail option Outlook.com
Figure 8: Search Outlook
Now, select Send an email option for sending the notification when an account is created in CRM.
Figure 9: Choose Send an email
Enter the Email address in “To” field which would get the email notification for every Account which gets created in CRM. Enter the Email Subject in the “Subject” field.
Microsoft flow provides you the ability to add the dynamic content by clicking on the Add dynamic content option as shown below:
Figure 10: Add dynamic content
Click on Show advanced options and select Yes under Is HTML field.
Figure 11: Select Show advanced optionFigure 12: Select Yes under Is HTML drop down
Go to mail Body and enter the text as shown in the below image:
<A href> tag is used for specifying a link destination. For now, I have provided the link of CRM Organization. Clicking on the link with navigate you to CRM homepage. <A HREF= ‘https://orgname.crm8.dynamics.com/main.aspx’>Click Here for details</A>
Figure 13: Prepare mail body
Hello Team,
Account AccountName has been created in CRM.
Please verify and approve it.
<A HREF= 'https://orgname.crm8.dynamics.com/main.aspx'>Click Here for details</A>
Regards,
CRM Team
Now
here is a trick for opening CRM record directly from the mail.
Login to CRM, open Account record. Get the Account record URL.
You would get the URL like the below URL which would contain the record GUID.
Microsoft Flow is a cloud-based service which helps to create workflow for automating the business process. These workflows are called as Flows.
Why use Microsoft Flows?
Microsoft Flow not only allows you to get integrated easily with any Microsoft products but also provide the ability to connect with the wide range of different products like Saleforce, Facebook, Twitter, Campfire, Gmail etc and many more.
Microsoft Flow by default come with multiple connectors which helps in creating workflow in very minimal time. It also gives you an ability to go ahead and create your own connectors.
Microsoft Flows can serve in many different ways. Like sending notification, Copying File, Collect Data , Collect Tweets and many more. Flows can be managed easily from desktop or mobile app.
How Microsoft Flowsworks?
For creating a flow, you need to know the trigger event and the set of actions which are required to be performed when the criteria is met.
The most common use of flow is to trigger notification on a specific event. Example: Whenever a Lead or Account is created in CRM then a notification should be sent via text message or email to the sales representative. This could be achieved easily by Microsoft Flows through connectors.
Connectors are basically the API proxy which helps the services to connect with flows.
Logic Apps is a cloud service which is managed by Microsoft Azure. It helps us in automating the business processes.
Why use Logic Apps?
Logic apps is very simple and has a very powerful workflow which is managed by Microsoft Azure. It helps in building a server less architecture, so the user does not have to worry about hosting, scaling or managing the solution. Azure Logic Apps contains 200+ connectors with it and provide users the facility to go ahead and implement another new connector if needed.
Logic apps has a very powerful architecture for logging and tracking the run history, trigger history and performance. All these activities can be access from a governance dashboard in Azure.
Another important advantage of Logic Apps is that “you pay only for what you use”. Pricing
is done based on the number of actions happening within the Logic Apps, if the
Logic Apps is sitting ideal there won’t be any charges incurred.
Components of Logic Apps
Trigger
Actions
Connectors
Flow Controls
How Logic Apps works?
Logic Apps works as a workflow which trigger when a specific event occurs or when any criteria is met.
Logic App can be scheduled as well so that it triggers on a time interval. User need to use a Schedule trigger.
Whenever the Logic App is triggered, the set of action
associated to it also gets executed. Actions can include multiple conditions
like switch statement, Looping, If and else condition or branching.
Example: Whenever a trigger detects an event which matched
the trigger criteria, it fires and run the workflow actions.
Microsoft Dynamics 365 CRM comes with many functionalities. One of the interesting functionalities is reading Barcode from mobile and tablet.
Let’s implement and check this out.
Create a custom field of type “Single line of Text”.
Figure 1: Create Custom Field
Place the field on the form. Select it and click on Change Properties button on the Home tab.
Figure 2: Place the custom field on Form
Below screen will appear you need to go to Controls tab and click on Add Control link.
Figure 3: Option for adding BarCodeFigure 4: Select option as Barcode Scanner
Now, select option as Phone and Tab. This is a mobile functionality. Click OK and Publish the Form for reflecting the changes across the Organisation.
Figure 5: Select Option as Phone and Tablet
Login CRM using D365 mobile app and open a record. Click on
the scanner icon which appear next to the Scanner field. This will turn on your
mobile camera and you will be able to scan the bar code of your product.
Figure 6: Option for scanning the Barcode
Scanning the Barcode. When the scan gets completed successfully the code associated to it will auto populate inside the Scanner field.
Figure 7: Scanning the Barcode.Figure 8: Barcode value got populated inside the Scanner field.
Note: The value inside the Scanner field will be visible from Web form as well.
Today you will learn how can you implement a traffic light indicator functionality in Power BI.
Power BI allows you to conditionally format a column based on another column value. Traffic Light indicator also works based on a value which is provided in the given column.
Figure 1: Image of Add hyperlink to CRM records in Power BI post.
Let’s get started. You need to add a new column to your dataset as shown in the below image:
Figure 2: Adding new column to datasetFigure 3: Created New Column
Rename
the column as “Indicator” for better
understanding.
After renaming use a Circle UNICHAR code 11044 next to Indicator for populating a Circle icon in the column.
Indicator = UNICHAR(11044)
Figure 4: Using Circle UNICHAR code11044
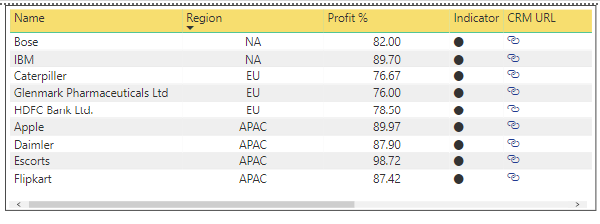
Select the table and check the box which appear next to Indicator column under dataset. This will add the Indicator column under report.
Figure 5: Added Indicator column to the report.
The circle under Indicator column will appear in black color.
For enabling the traffic light capability, you need to right click on the Indicator column and select Conditional formatting –> Font color. This will change the Font color of circles.
Figure 6: Right click on Indicator columnFigure 7: Select Conditional formatting –> Font color
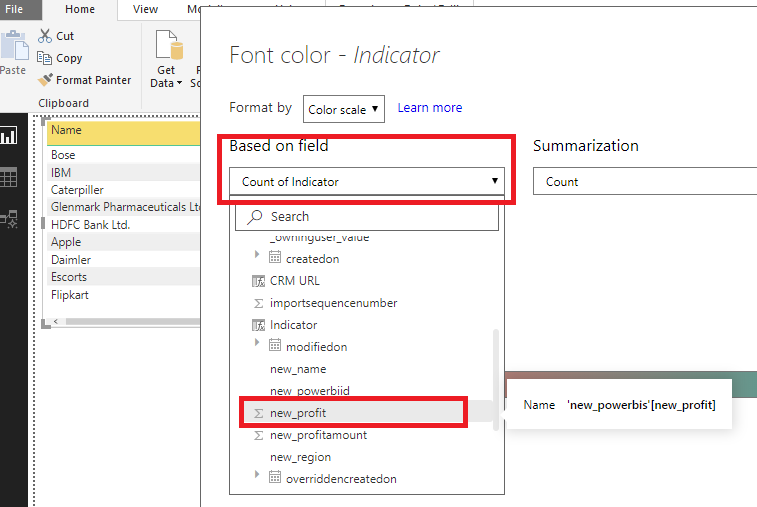
The below screen will appear, click on Based on field dropdown. Select the column based on which the traffic light indicator would work.
Figure 8: Font color default screen
In
my case I am going to use Profit %(new_profit) column. Which is the third
column in our table.
Figure 9: Select field based on which the traffic light indicator would work.
Go to Diverging and check the box which appear next to it. This will populate a new field “Center” between “Minimum” and “Maximum”.
Figure 10: Check the Diverging field
Select Number value under the dropdown which appear below Minimum, Center and Maximum fields. Provide the number range for the Indicator column based on this the traffic light functionality would work. Then click OK.
Note: The color bar which appear below the
Diverging field is totally based on the colors which you select under the
Minimum, Center and Maximum fields.
Note: I have taken the minimum number as 0 which
mean the number which appear nearest to 0 under Profit % column will appear as
brightest red and the number which is nearest to 70 will appear the brightest
yellow. The number which appear somewhat near 50 will be a mix of Red and
Yellow color.
Figure 11: Enter value range for Indicator
Now, you have got the functionality that you wanted. The Indicator column appear as a Traffic Light Indicator.
Today, we are going to learn how to hyperlink CRM entity records using Power BI desktop.
Figure 1: Use hyperlink in CRM Power BI Report
For
creating a hyperlink in Power BI report. Load the data from CRM entity.
I have used a custom entity having schema name as “new_powerbi” for this post. Select the columns which is require for your reporting purpose.
After that click on “New Column” button which appears on the menu bar or you can right click on the “new_powerbis” data set and select New column option.
Figure 2: Create New column for hyperlink
This will open an editor where the mapping must be done for fulfilling the hyperlinking functionality.
Note: Before you proceed with hyperlink, make sure that you have a “primaryid” in your dataset. This is required for opening an individual record when a you click on the link without any conflict.
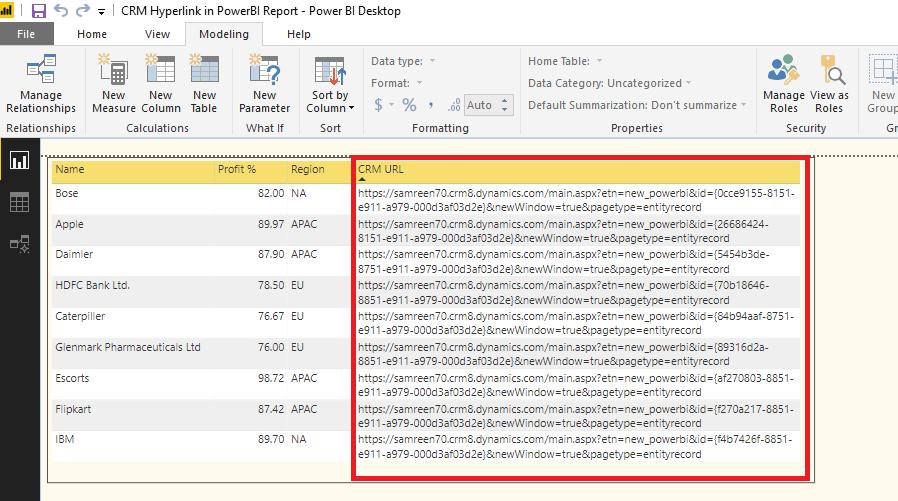
Clicking on enter will add a new column to your report. The column will contain the URL of each record in the form of text.
Figure 5: Fetch CRM URL in text format
For
converting the whole big URL from text to hyperlink. You need to click on Data,
go to Modeling tab.
Select CRM URL column and Click on “Data Category: Uncategorized” dropdown. Then select Web URL option. This action will convert the text url into hyperlink format.
Figure 6: Convert text URL to hyperlink format
Navigate back to Report. You will find that the text in CRM
URL columns has been converted from text to hyperlink format.
Figure 7: CRM URL column having hyperlink URL
Now, you need to click in CRM URL column and Go to Format –> Values. As shown in the below image.
Figure 8: Option to convert link url to link icon
Clicking on Values you will find an option “URL icon” turn it On. This will change the entire column hyperlink url to a hyperlink icon.
Figure 9: Enable URL icon on CRM URL column
Clicking on the URL icon will redirect you to CRM entity record.
This article is about the workaround which a user can adopt. If user want to populated the CRM Option Set Label in report.
Power BI suite has a limitation that it shows the CRM option set Value not Label.
Please refer the previous blog(Power BI with Microsoft Dynamics CRM) for understanding how to establishing a connection between Power BI suite and Dynamics CRM for loading a data into Power BI.
Suppose, a you wants to create a report with Account Name and Region field. Considering, Region is an option set field.
Figure 1: Creating a Table report
For getting the option set label, you need to create a dummy query where you need to map the Option Set Labels and Values.
Click on the Edit Queries button on the Menu bar. The below screen will pop up, right click on the Queries. New Query –> Select Blank Query option
Figure 2: Create Query
A table would get created. Refer the below query format and paste it in the editor.
Figure 3: Table created for option set Label and Value mapping.
You can rename the table by right clicking on it. Choose Rename. Click on Close & Apply button, select Close & Apply option.
Figure 4: Save the changes
This will load the new table with columns, and bring you back to Report.
After this you will need to establish a relationship between the Account and Region. Click on “Model” as shown in the below image in yellow box.
Figure 5: Manage Relationship between Account and Region table
Click on “Manage Relationships” button. Below screen will appear now click on “New” button for creating relationship
Figure 6: Create Relationship
Select the tables between which you want to create a relationship. Like Account and Region in my case. As I want to populate the Account Region option set label in the report.
Next click on the column which has the similar data in both the tables for mapping. Then click “OK” button.
Figure 7 : Mapping the common column from both the tables.
Clicking on “OK“. The below screen will appear where you can see the relationship which got created. Click “Close” button.
Figure 8 : Relationship established
Coming back to Model, you can now view a link between the two tables.
Figure 9 : Relationship established between Account and Region.
Click on Report and select the Label field from the Region Table.
Figure 10: Region option set Label populated.Figure 11: Power BI Table Report